Indiana DWD Releases January Employment Report
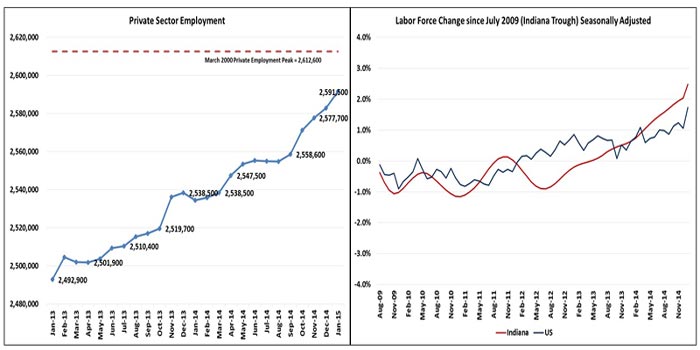
The Hoosier State added 8,600 private sector jobs in January, led primarily by the Trade, Transportation & Utilities (+6,700), and Manufacturing (+1,500) Sectors. Over the past two years, Indiana’s private sector has grown by 98,600 jobs. During this period, monthly job growth has averaged 4,100, and the state has experienced gains in 19 of the past 24 months. Since July 2009, the low point of employment, 268,300 private sector jobs have been added in total. Indiana now stands at just 21,100 private sector jobs below the all-time peak of employment in the state, which occurred in March of 2000.
Despite sizable private sector gains, Indiana’s unemployment rate was driven up 0.1 percent to 6.0 percent in January mainly due to another substantial labor force increase (+14,249). The Hoosier labor force has grown by 85,500 individuals over the past two years, which is one of the largest increases in the nation. Indiana’s labor force participation rate also increased in January by 0.2 percent to 63.9 percent, and continues to be a full percentage point higher than the national average. January also marks the 10th month in a row Indiana’s labor force participation rate exceeded the national rate.
“Hoosier private sector job growth continued a remarkable trajectory in January,” said Steven J. Braun, Commissioner of the Indiana Department of Workforce Development. “Over the past two years, Indiana has grown nearly 100,000 private sector jobs, and scores of Hoosiers are returning to the labor force. Clearly, the numbers indicate many Hoosiers are returning to work and thousands of others, encouraged by the availability of new jobs, are beginning to look for work again, which are both tangible positive economic indicators.”
 Employment by Sector
Sectors showing gains in January include: Trade, Transportation & Utilities (6,700), Manufacturing (1,500), Private Educational & Health Services (900), Professional and Business Services (500), and Leisure and Hospitality (200). The Construction (-2,800), and Financial Activities (-100) sectors declined in January. Total nonfarm employment increased in January (5,500).
Midwest Unemployment Rates
| January 2014 | December 2014 | January 2015 | Monthly Change | |
|---|---|---|---|---|
| Indiana | 6.2% | 5.9% | 6.0% | 0.1% |
| U.S. | 6.6% | 5.6% | 5.7% | 0.1% |
| Illinois | 8.2% | 6.2% | 6.1% | -0.1% |
| Kentucky | 7.5% | 5.5% | 5.5% | 0.0% |
| Michigan | 7.9% | 6.4% | 6.3% | -0.1% |
| Ohio | 6.5% | 5.1% | 5.1% | 0.0% |
EDITOR’S NOTE: Total private sector jobs were revised downward (-11,500) in the month of December for 2014 during the yearly benchmarking process by the U.S. Bureau of Labor Statistics.
January employment data for Indiana Counties, Cities, and MSA’s will be available at 12 p.m. Wednesday, March 18, 2015 pending U.S. Bureau of Labor Statistics validation.
The February 2015 Indiana Employment Report will be released on Friday, March 27, and the February 2015 Indiana County, City and MSA Employment Report will be released at 12 p.m. Monday, March 30 due to the yearly benchmarking process by the U.S. Bureau of Labor Statistics.
